Performance Metrics Masterclass – Lesson 4: Zone Entries, Exits & Transition Speed
By Coach Mark Lehtonen · IHM Academy
In today’s game, puck possession isn’t won in the offensive zone – it’s won in transition.
Neutral-zone efficiency determines who dictates pace.
Controlled entries create offense; clean exits prevent momentum swings.
Transition speed is the glue that connects both.
Zone entries, exits, and transition speed are three of the most predictive metrics of scoring chances. They measure how quickly a team moves the puck from defense to offense, how efficiently it crosses blue lines, and how much control it maintains through these sequences. NHL analytics departments track these numbers obsessively – and for a reason.
You don’t need 60% possession to win.
You need to be faster and cleaner in the moments that create possession.
🎯 Primary Objectives
- Convert defensive stops into possession-driven exits
- Create controlled entries that evolve into structured attacks
- Reduce “stall points” and slow recoveries in the neutral zone
- Build predictable support layers during every transition
- Measure individual and team contribution to puck-movement efficiency
This is where raw skating meets tactical intelligence.
🧠 Key Concepts
1. Controlled Exits
Clean exits = clean attacks.
Teams with high controlled exit percentages generate nearly double the expected goals per entry.
Indicators of elite exits:
- First support option is available within 2 seconds
- D-man does NOT rim unless under heavy pressure
- Center connects low to provide a safety valve
- Weak-side winger anticipates the release lane
- No “dead stops” behind the net
If you break out slow, you enter slow.
2. Controlled Entries
Possession entries lead to:
✔ zone time
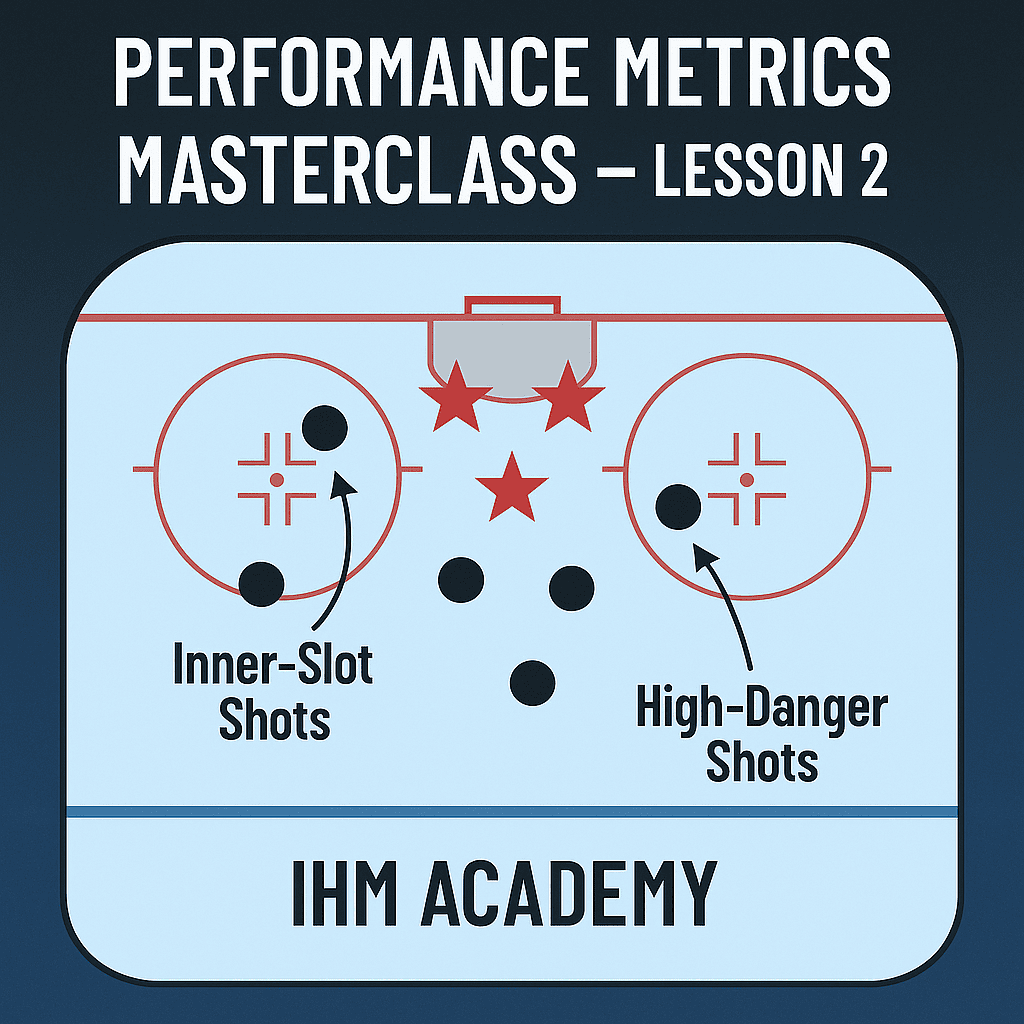
✔ shot quality
✔ sustained pressure
✔ layered attacks
Dump-ins can be useful, but controlled entries consistently produce higher xG.
Attributes of high-value entries:
- Forward enters with speed
- At least two passing options cross the line together
- Weak-side forward is already inside the zone
- Defenders are forced to back-off, not gap up
Entries with speed collapse defensive structure instantly.
3. Transition Speed
Transition speed is NOT raw skating speed.
It’s decision speed + support speed.
Measures include:
- Time from turnover → first controlled pass
- Time from DZ recovery → neutral zone possession
- Length of “transition sequences”
- Layer spacing during attacks
Transition speed reveals how “connected” the team is.
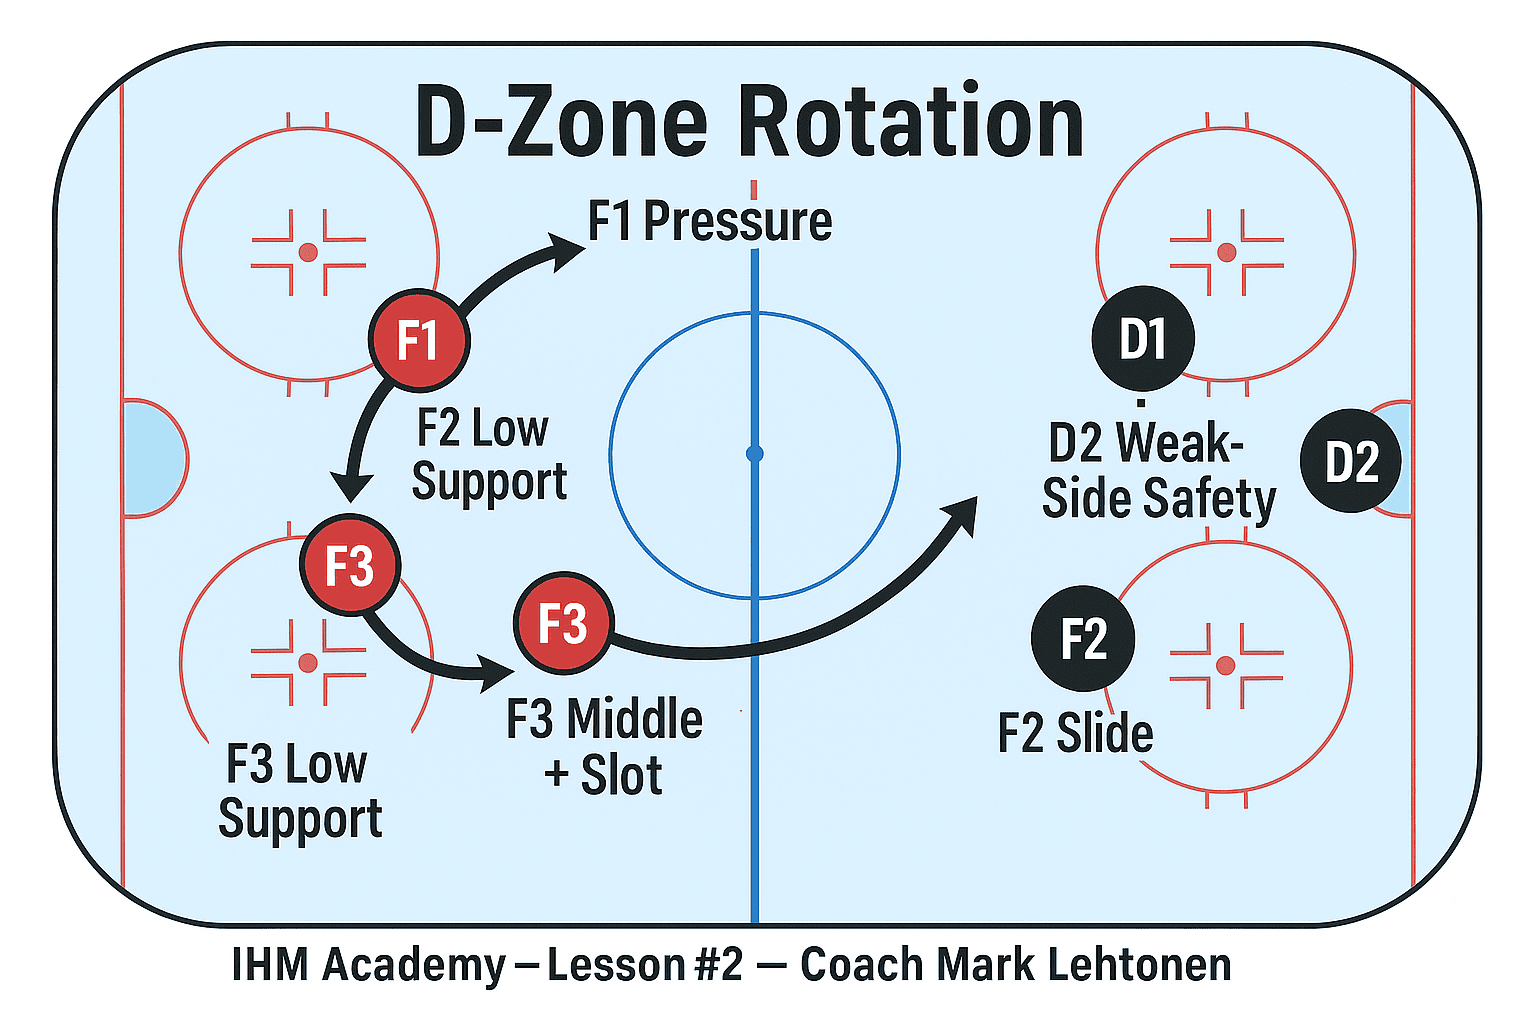
🧩 Role Breakdown
Defensemen
- Quick first read
- Middle-first philosophy
- Avoid long holds unless resetting structure
- Precision in early puck touches
Centers
- Primary transition engine
- Must be below the puck on exits, above it on entries
- Best neutral-zone “spine” on the roster
Wingers
- Anticipate lanes, not react to them
- Stretch D on entries
- Collapse to middle for exits
- Support north-south flow
🔧 Metrics & What They Mean
- Controlled Exit % → how often possession starts clean
- Controlled Entry % → chance creation predictor
- Transition Speed (sec) → tempo and decision-making
- Regroup Turnover Rate → efficiency under pressure
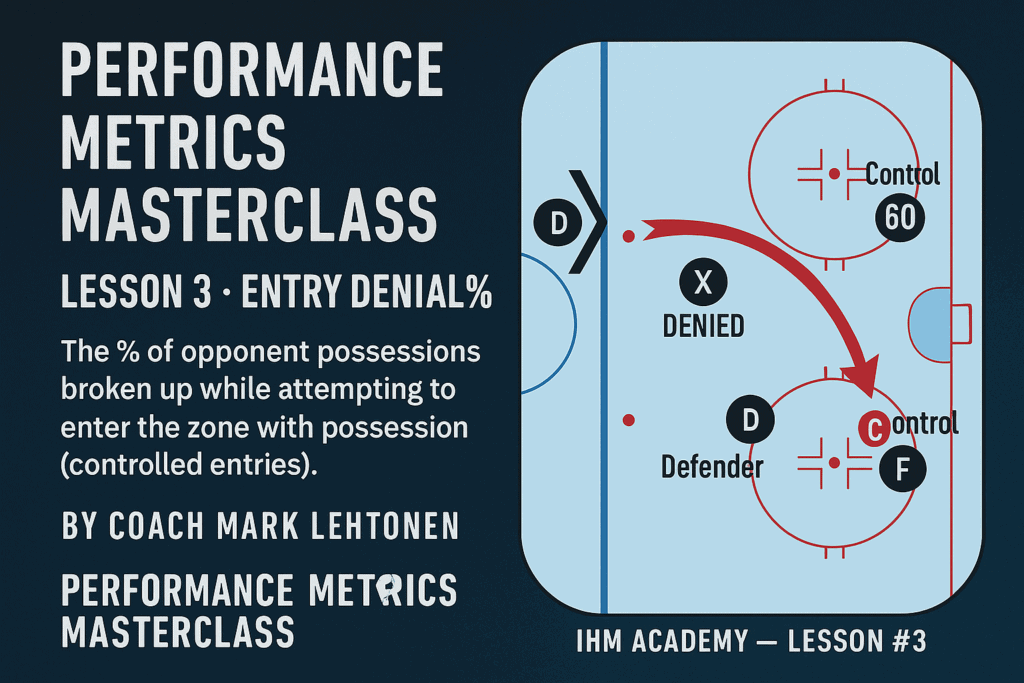
- Entry Denial % (defense) → defensive transition impact
These are the numbers that win playoff series.
💬 Coach Mark Lehtonen says
Transition isn’t about being fast – it’s about being connected.
Slow teams are disconnected teams.If your exits are bad, your entries will be bad.
If your entries are bad, your offense will be bad.
The game starts in the zone you leave.
❌ Common Mistakes
| Mistake | Consequence |
|---|---|
| Wingers fly too high | No support → forced dump |
| Center late on exit | Defense stuck under pressure |
| D-man rimming too early | Turnovers + lost possession |
| Slow neutral-zone regroup | Opponent resets structure |
| Entry without layers | One-and-done attacks |
🧪 Micro-Drills
- 3-Lane Transition Relay - timing & lane discipline
- D→C→W Exit Triangle - quick-support sequencing
- Regroup Pressure Drill - fast decisions under squeeze
- Controlled Entry Timing Series - layered attack entry
🧱 Summary
Zone entries, zone exits, and transition speed are the heartbeat of modern hockey.
If your team wins the transition game, you control pace, space, and momentum.
You don’t need elite talent to transition well.
You need structure, timing, and support that never dies.
❓ Questions & Answers | IHM Performance Metrics
What is a controlled zone exit?
A controlled zone exit is when a team leaves the defensive zone with possession, usually through a clean D→C→W sequence or a stretch option. It predicts stronger offensive transitions.
Why do controlled entries matter?
Because controlled entries create better shot locations, longer possessions, and higher expected goals compared to dump-and-chase plays.
How do you measure transition speed?
Transition speed is measured by timing how quickly a team moves from puck recovery to neutral-zone possession or from the neutral zone into a controlled entry.
What hurts transition the most?
Late support, long hesitation with the puck, poor lane timing, and a slow center on exits are the biggest killers of transition tempo.
What is the role of the center in transition?
The center acts as the primary support engine – low on exits, high on entries, creating constant connection between defense and forwards.