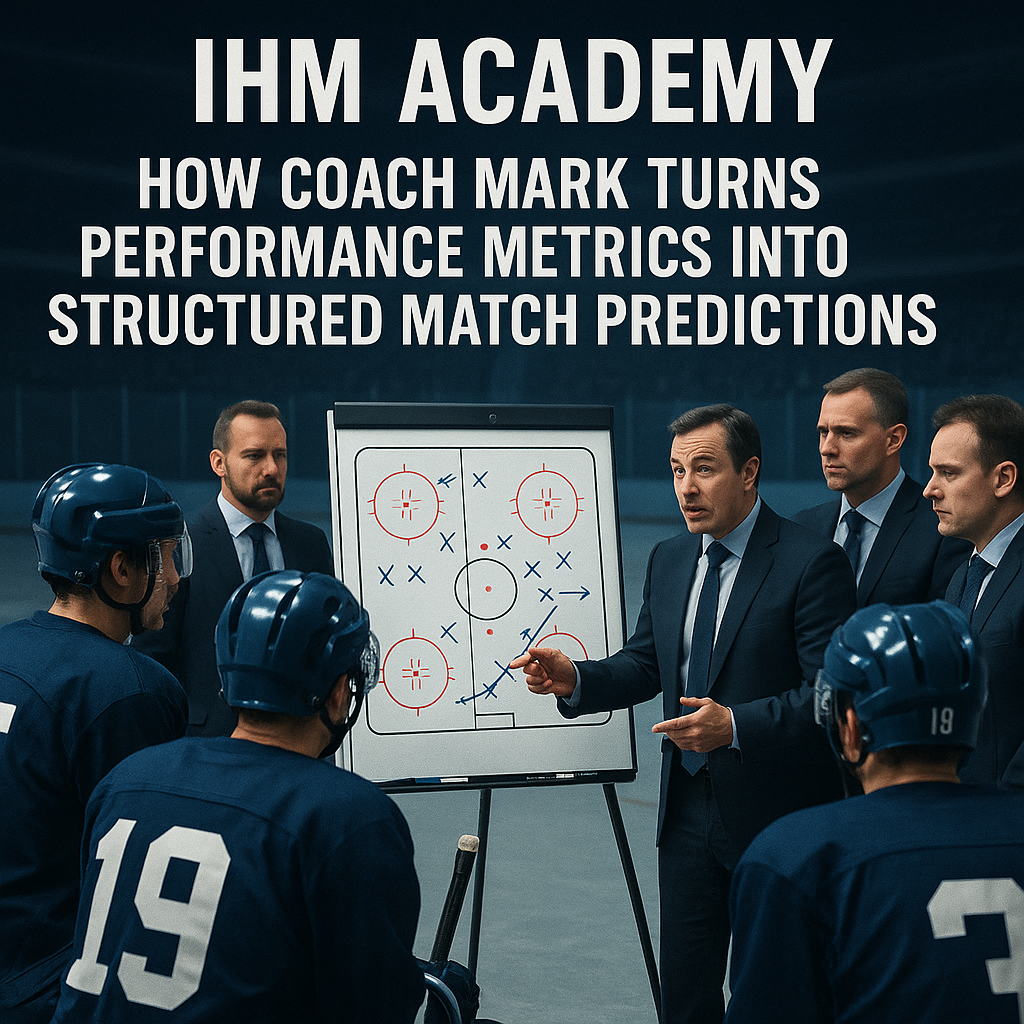
How Coach Mark Turns Performance Metrics Into Structured Match Verdicts
The Hidden Architecture Behind IHM Premium Analysis
IHM Academy - Performance Metrics Masterclass
1. Why Most People Misread Hockey – And Coaches Don’t
The biggest illusion in modern hockey is believing that goals are the starting point of analysis. Goals are not the cause; they are the final visible consequence of dozens of earlier decisions and structural battles that most viewers never notice.
Most fans focus on what is easy to see:
- goals and highlight plays
- shot totals
- big hits
- scoreboard and standings
Professional coaches and their staffs look at completely different layers:
- who controls space between the blue lines
- how efficient the forecheck truly is
- who owns the slot and net-front battles
- how fatigue builds up shift by shift
- how the coaching staff on each bench manages matchups, ice time, and tactical adjustments
Most people react to what already happened. Coaches predict what is about to happen.
Coach Mark’s entire analytical system inside IHM Premium is built on this exact difference. He and his staff are not chasing results; they read processes, structures, and coaching decisions that create results.
2. Performance Metrics Are Predictive Signals, Not Just Statistics
Public statistics are mostly descriptive. They tell you what already happened:
- shots on goal
- faceoff percentage
- time on attack
- power play goals
Performance metrics are different. They are predictive signals. They indicate what is likely to happen next if game structure remains unchanged.
Coach Mark does not start with:
- “Who had more shots last night?”
- “Who scored more goals recently?”
He starts with:
- “Who will control the next ten minutes?”
- “Whose structure survives fatigue better?”
- “How will each coaching staff impose their preferred game script?”
3. Neutral Zone Control – Where Games Are Quietly Won
The neutral zone is the center of tactical gravity in modern hockey. It governs tempo, limits risk, and determines how attacks are born or destroyed.
If a team controls:
- blue-line spacing
- gap control
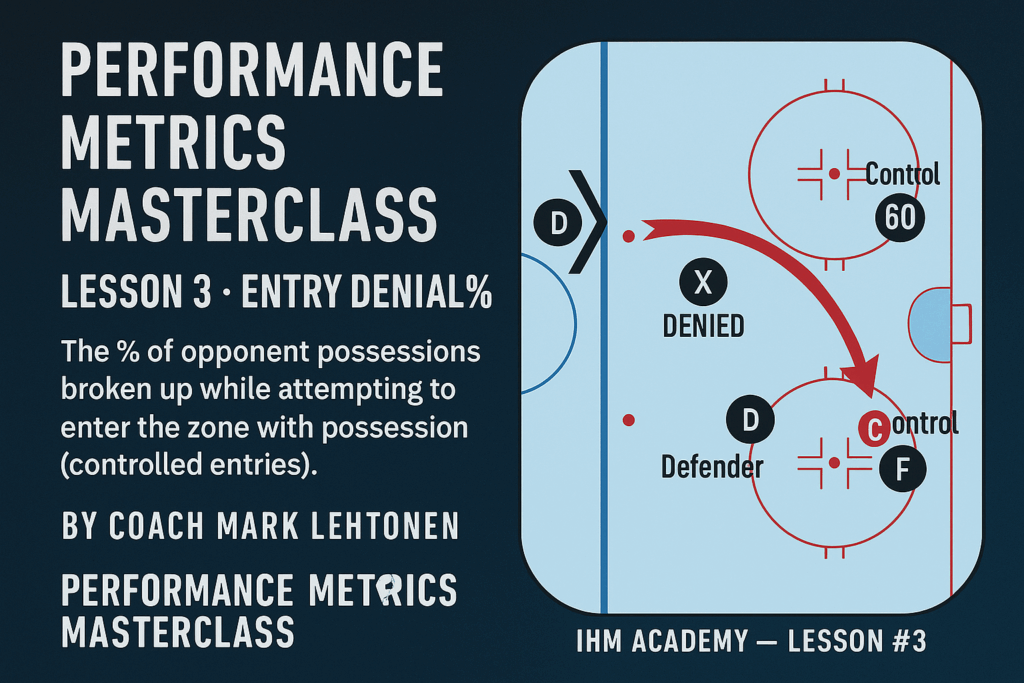
- entry denial
- clean transition exits
It also controls:
- offensive rhythm
- defensive recovery
- true scoring danger
- the opponent coaching staff’s ability to execute its game plan
How Coach Mark Uses Neutral Zone Metrics
- Entry Suppression Rate
- Controlled Entry Ratio
- Turnover-to-Transition Speed
If one team suppresses controlled entries above 55-60% while the other depends on rush speed, Mark already knows the structure favors the defensive side.
The attacking team will lose quality over time, even if raw shot numbers look balanced.
The Coaching Staff Factor
- Does the staff rely on speed transitions or controlled buildup?
- Do they adapt when neutral traps shut them down?
- Is there a tactical “Plan B”?
When a coaching staff is structurally rigid, neutral zone dominance becomes even more decisive in shaping Mark’s verdict.
4. Forecheck Efficiency – Pressure Without Shooting
Forechecking at elite level is not chaos. It is structured exit destruction.
- forced dump-outs
- failed breakouts
- compressed recovery windows
- accelerated defensive fatigue
Coaching Staff Influence in Forechecking
- preferred forecheck structure
- aggression timing
- risk tolerance
- in-game system switching
Metrics alone are not enough. Mark evaluates how the coaching staff deploys pressure and how stable this pressure is across all three periods before arriving at his verdict.
5. Slot Dominance – Why Shot Totals Deceive
Over 70% of elite-level goals originate from the slot or direct rebound aftermaths. Perimeter shots are often low-probability events; slot control is where real danger lives.
- Slot Entry Frequency
- Net-Front Battle Win Rate
- Slot Denial Efficiency
One lost rebound battle can collapse an entire match structure.
Coach Mark studies not only numbers but also:
- defensive coverage schemes
- net-front defender roles
- coaching reactions between periods
His final verdict always reflects which side is more likely to own the slot over sixty minutes, not just who shoots more.
6. Shift Load & Fatigue Control – The Invisible Match Killer
Fatigue is one of the most underestimated factors in hockey. It is rarely visible to casual viewers but constantly monitored inside a professional bench.
- Average Shift Length
- High-Intensity Burst Count
- Recovery Windows
- Late-Shift Error Clusters
Fatigue does not announce itself. It reveals itself through structural breakdowns.
Coach Decisions Under Fatigue
- bench shortening behavior
- timeout timing
- rotation protection
When Mark sees a pattern of poor fatigue management from a coaching staff, his match verdict will always reflect the higher probability of late-period collapses and momentum swings.
7. The Real Pre-Game Checklist at IHM
Before any match verdict is published for IHM Premium, Coach Mark and his staff run through a structured pre-game checklist:
- Neutral Zone Geometry - who owns space between the blue lines.
- Forecheck Stability - who can consistently disrupt exits.
- Slot Control Projection - who is more likely to control the net-front area.
- Fatigue Curves - how each team’s structure behaves under load.
- Goaltender Visibility & Traffic - projected screen quality and rebound chaos.
- Bench Recovery Cycles - shift length, depth usage, and rest patterns.
- Coaching Staff Adaptation History - how each bench reacts when the original game plan fails.
Only after this structural analysis do they move to rosters, injuries, special teams, and schedule context. The verdict is the final product of this entire process, not a guess based on recent scores.
8. Why This System Outperforms Public Result-Driven Logic
Public thinking follows outcomes. Professional thinking follows structure.
Casual logic:
- “This team is on a winning streak, they must be stronger.”
- “They scored a lot recently, so they will keep scoring.”
Coach Mark’s logic:
- “Who controls space and tempo?”
- “Whose structure survives fatigue and pressure?”
- “Which coaching staff reads the game faster and adjusts better?”
Processes always happen before results. That is why his verdicts are built on structural reality, not emotional narratives.
9. Why IHM Academy Exists
IHM Academy exists to teach how professional coaching staffs truly see the game – beyond highlights and surface statistics. It is designed for readers who want to think like a bench, not like a scoreboard.
Every Performance Metrics lesson is built to:
- explain deep tactical concepts in clear language
- connect numbers with video and coaching decisions
- show why structure matters more than isolated plays
- prepare you to understand the logic behind Mark’s verdicts
10. From Theory to Premium - How Knowledge Becomes Structure
- First you learn how hockey truly works at the structural level.
- Then you begin to understand why specific results appear on the scoreboard.
- Next you observe how Coach Mark and his staff apply the same principles in real pre-game work.
- Finally you develop analytical discipline and can evaluate match verdicts on a professional basis.
IHM Premium is not about guessing every game. It is about choosing your spots, identifying real structural edges, and respecting the game at the level of a coaching staff.
11. Final Truth
Hockey is not chaos. It is order disguised as chaos.
- Structure before speed
- Fatigue before mistakes
- Slot before shots
- Coaching decisions before visible outcomes