NHL SHORT ICE - Draft Stories and Trade Questions Dominate Headlines
Date: June 28, 2026
By IceHockeyMan Newsroom
The NHL Draft may be over, but the stories surrounding it are only getting started. From emotional family moments and historic selections to major trade questions involving franchise stars, the league is quickly shifting from draft weekend into full offseason mode.
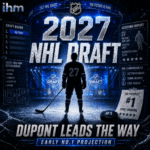
The Hockey World Is Already Looking Toward The 2027 NHL Draft
Less than 48 hours after the 2026 NHL Draft concluded, scouts are already talking about the next potential superstar.
Everett defenseman Landon DuPont currently projects as the No. 1 pick for the 2027 NHL Draft after producing 73 points in the WHL this season.
The young defenseman is already drawing enormous attention because of his offensive upside, skating and ability to control the game from the blue line.
IHM Signal:
When a defenseman becomes the early favourite for the first overall pick, it usually means scouts believe he has true franchise-changing potential.
READ FULL POST:
2027 NHL Draft Lookahead: Why Landon DuPont Is Already The Player Everyone Is Watching
Gavin McKenna’s Draft Weekend Continues To Grow
The No. 1 overall pick is already becoming one of hockey’s biggest personalities.
After being selected by Toronto, Gavin McKenna arrived in the city to a hero’s welcome and even threw out the ceremonial first pitch for the Toronto Blue Jays.
The excitement around McKenna extends far beyond the draft floor. Toronto appears fully invested in making him one of the faces of the franchise’s future.
The attention also shows the enormous expectations that now follow him into the NHL.
NHL Draft Bloodlines Continue To Shine
Several selections during the 2026 NHL Draft came from hockey families, including Nashville’s first-round pick Cullen, the son of longtime NHL veteran Matt Cullen.
The league continues to see second-generation players arrive with unique advantages: exposure to professional environments, understanding of expectations and experience growing up around the game.
Bloodlines never guarantee success, but they often provide an early education that cannot easily be taught.
The Ruck Twins Deliver One Of The Draft’s Best Stories
Pittsburgh created one of the most emotional moments of draft weekend by reuniting twins Liam and Markus Ruck.
The Penguins selected Liam first before bringing Markus into the organisation the following day, turning a shared childhood dream into reality.
Stories like these are part of what makes the draft special. Behind every selection is a family journey that often stretches back more than a decade.
READ FULL POST:
Shared Dream: The Ruck Twins Begin Their Journey Together In Pittsburgh
San Jose Makes NHL History With A Giant Selection
The Sharks selected a 7-foot-1 defenseman in the seventh round, making him the tallest draft pick in NHL history.
The unusual selection immediately became one of the most talked-about moments of the draft.
Size alone never guarantees success, but hockey fans will now be watching closely to see how such a unique physical profile develops in professional hockey.
Niagara University’s Emotional Draft Moment
One of the most touching stories of the weekend came from Niagara University, where teammates honoured a late teammate while announcing Buffalo’s fourth-round selection.
The moment served as another reminder that hockey is often about community and relationships just as much as wins and losses.
Ovechkin And Capitals Expected To Hold Talks
The Washington Capitals and Alex Ovechkin are expected to speak in the near future regarding a potential return next season.
Head coach Spencer Carbery indicated that Ovechkin has been very impressed by the additions of Jordan Kyrou and Alex Tuch.
Those moves suggest Washington still believes it can compete immediately and may help convince its captain to continue his legendary career.
IHM Signal:
When a team aggressively adds talent around an aging superstar, it often signals one final push to remain competitive.
READ FULL POST:
What Does The Future Hold For Alex Ovechkin And The Capitals?”
Dylan Larkin Situation Becomes One Of Summer’s Biggest Stories
Detroit general manager Steve Yzerman admitted there are no guarantees regarding captain Dylan Larkin’s trade request.
According to Yzerman, Larkin has provided a short list of teams to which he would consider waiving his no-trade clause.
That revelation instantly creates one of the biggest storylines of the offseason.
Captains requesting trades are rare, and if Detroit decides to move its franchise player, the effects could reshape multiple teams around the league.
Carolina Quietly Adds John Carlson’s Rights
The Hurricanes acquired the negotiating rights to defenseman John Carlson from Anaheim.
The move gives Carolina an opportunity to speak with Carlson before he reaches free agency on July 1.
Whether a contract ultimately happens remains unclear, but the move shows that the reigning Stanley Cup champions are not standing still.
Martinook Creates One Of The Funniest Draft Moments
Jordan Martinook provided one of draft weekend’s lighter moments when he essentially took matters into his own hands and announced Carolina’s draft selection.
The spontaneous moment quickly spread online and perfectly captured the relaxed atmosphere surrounding the newly crowned Stanley Cup champions.
Top Moments Of The 2026 NHL Draft
- The Ruck twins joining Pittsburgh together.
- Gavin McKenna becoming the face of Toronto’s future.
- The Sharks selecting the tallest player in draft history.
- Emotional tributes from Niagara University.
- Sweden’s impressive first-round performance.
Trending Signals
- The 2027 NHL Draft conversation has already started.
- Toronto is fully embracing the Gavin McKenna era.
- Detroit’s captain situation could become one of the summer’s biggest stories.
- Washington still appears committed to competing with Ovechkin.
- Carolina continues exploring ways to improve despite winning the Stanley Cup.
Coach Mark Comment
The draft may be over, but this is usually when the real NHL chess game begins. Teams start evaluating what they truly are and what they still need. The most interesting situations right now involve veterans and franchise players. Detroit, Washington and Carolina all face important decisions that could shape the next stage of their competitive windows.
Fan Pulse
Which story interests you the most right now: Dylan Larkin’s trade request, Ovechkin’s future, or the beginning of the Gavin McKenna era in Toronto?
Q&A: NHL Draft And Offseason Update
Who is projected to be the No. 1 pick in 2027?
Everett defenseman Landon DuPont currently projects as the top prospect.
Which player became the face of Toronto’s draft class?
Gavin McKenna after being selected first overall.
What made the Ruck twins story special?
Pittsburgh drafted both brothers, allowing them to continue their hockey journey together.
Why is Dylan Larkin’s situation important?
A captain requesting a trade could dramatically affect the offseason market.
What are the Capitals discussing with Ovechkin?
The possibility of his return for next season.
Why did Carolina acquire John Carlson’s rights?
To negotiate with him before free agency begins.