Tag: ihm academy

IHM Academy · Performance Metrics Masterclass - Lesson 18

IHM Academy · Performance Metrics Masterclass - Lesson 18

Lesson 18 - Transition Speed Index (TSI) & Counter-Attack Structure

Extended Core Definition

The Transition Speed Index (TSI) measures how quickly and efficiently a team converts a defensive recovery into an organized attacking threat. It does not describe raw skating speed. It measures structural decision velocity under pressure: retrieval, first pass, support, lane activation, and timing of the second wave.

Game Impact Map

  • Tempo: High TSI accelerates game rhythm and compresses opponent reset windows.
  • Structure: Forces defenders into back-pressure chases, stretching gap control.
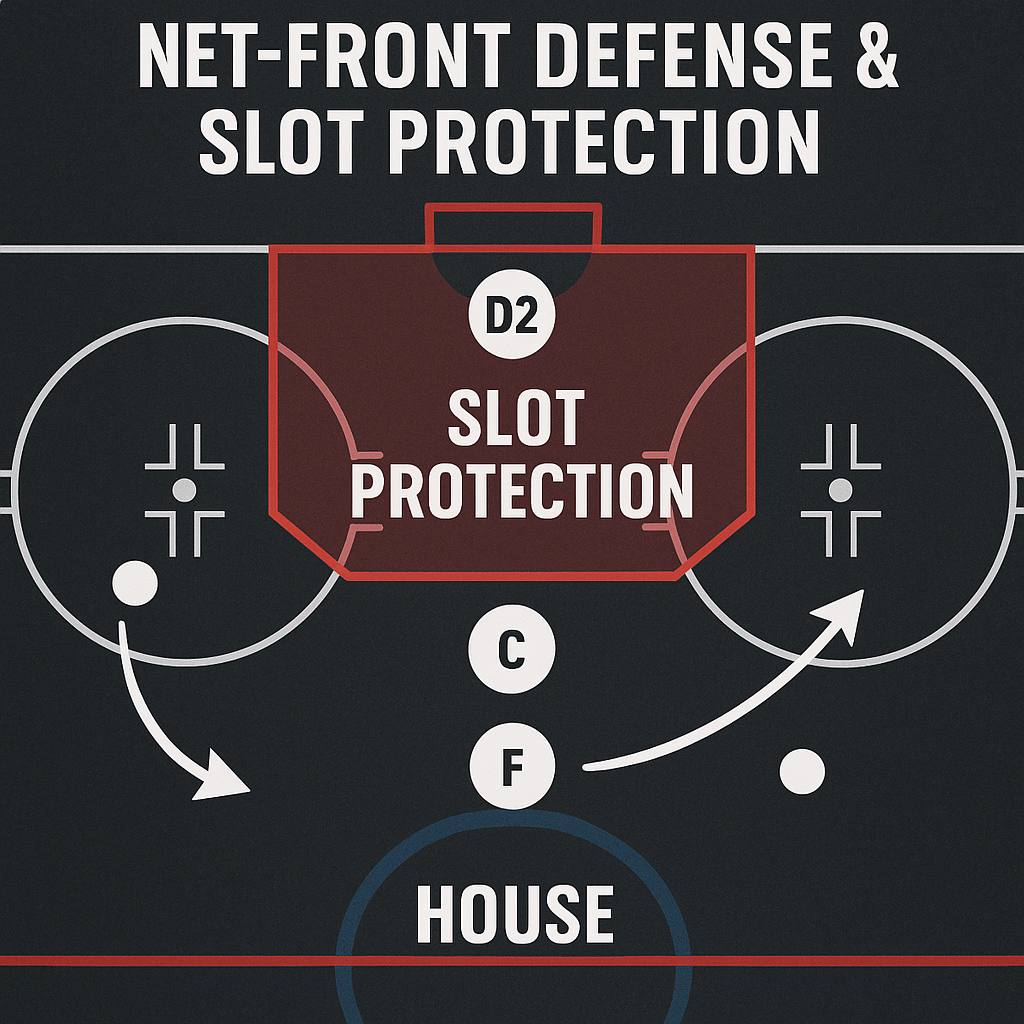
  • Shot Quality: Increases lateral slot entries and cross-crease chances.
  • Late Mistakes: Fatigued defenders misjudge angles on repeated fast counters.
  • Final Verdict: Sustained TSI superiority shifts late-game probability curves.

Tactical Layer

  • Even Strength: rapid F1 retrieval + early F2 acceleration opens weak-side seams.
  • After Failed Entries: fast re-attack before defensive box resets.
  • After Goals Against: elite TSI teams immediately retake initiative.

Coaching Staff Layer

The coaching staff defines whether transitions are restrained or aggressive. Bench decisions include defense activation limits, early support depth, and permitted risk in the first five seconds after recovery.

How Coach Mark Uses This in Real Pre-Game Analysis

Before the match, Coach Mark evaluates how each team generates speed after retrieval: which defense pairings activate, whether F3 stays high or collapses, and how quickly the neutral lanes fill. In the first period, he reads whether clean exits convert into synchronized rush layers or isolated solo entries.

In the second period, Mark tracks fatigue impact on TSI. If transition acceleration remains stable despite long shifts, the structural advantage is confirmed. In the third period, sustained TSI usually translates into repeated defensive scrambling for the opponent and a rising probability of late organizational breakdowns.

Verdict Translation Layer

When one team holds a persistent TSI edge versus an opponent with aggressive defense pinches, Mark’s verdict logic leans toward late initiative dominance and structural control after momentum swings.

Advanced Mistake Patterns

  • Teams overestimate TSI without neutral support layers.
  • High TSI collapses if retrievals lack first-pass precision.
  • Late-game TSI drops signal imminent structural loss.

Q&A – Transition Speed Index (TSI) & Counter-Attack Structure

Q: Can elite TSI survive against compact neutral traps?
A: Only with disguised middle-lane support.

Q: What kills TSI fastest?
A: Shortened bench rotations and delayed first passes.

Q: Is TSI more dangerous on small rinks?
A: Yes. Reduced space amplifies timing advantages.

Q: Does power play speed reflect true TSI?
A: No. TSI is measured primarily at even strength.

Q: Can low-TSI teams still win?
A: Yes, through neutral suppression and slot sealing.


IHM Academy · Performance Metrics - How Coach Mark Lehtonen Turns Performance Metrics Into Structured Match Verdicts

IHM Academy · Performance Metrics – How Coach Mark Lehtonen Turns Performance Metrics Into Structured Match Verdicts

How Coach Mark Turns Performance Metrics Into Structured Match Verdicts

The Hidden Architecture Behind IHM Premium Analysis

IHM Academy - Performance Metrics Masterclass

1. Why Most People Misread Hockey – And Coaches Don’t

The biggest illusion in modern hockey is believing that goals are the starting point of analysis. Goals are not the cause; they are the final visible consequence of dozens of earlier decisions and structural battles that most viewers never notice.

Most fans focus on what is easy to see:

  • goals and highlight plays
  • shot totals
  • big hits
  • scoreboard and standings

Professional coaches and their staffs look at completely different layers:

  • who controls space between the blue lines
  • how efficient the forecheck truly is
  • who owns the slot and net-front battles
  • how fatigue builds up shift by shift
  • how the coaching staff on each bench manages matchups, ice time, and tactical adjustments

Most people react to what already happened. Coaches predict what is about to happen.

Coach Mark’s entire analytical system inside IHM Premium is built on this exact difference. He and his staff are not chasing results; they read processes, structures, and coaching decisions that create results.

2. Performance Metrics Are Predictive Signals, Not Just Statistics

Public statistics are mostly descriptive. They tell you what already happened:

  • shots on goal
  • faceoff percentage
  • time on attack
  • power play goals

Performance metrics are different. They are predictive signals. They indicate what is likely to happen next if game structure remains unchanged.

Coach Mark does not start with:

  • “Who had more shots last night?”
  • “Who scored more goals recently?”

He starts with:

  • “Who will control the next ten minutes?”
  • “Whose structure survives fatigue better?”
  • “How will each coaching staff impose their preferred game script?”

3. Neutral Zone Control – Where Games Are Quietly Won

The neutral zone is the center of tactical gravity in modern hockey. It governs tempo, limits risk, and determines how attacks are born or destroyed.

If a team controls:

  • blue-line spacing
  • gap control
  • entry denial
  • clean transition exits

It also controls:

  • offensive rhythm
  • defensive recovery
  • true scoring danger
  • the opponent coaching staff’s ability to execute its game plan

How Coach Mark Uses Neutral Zone Metrics

  • Entry Suppression Rate
  • Controlled Entry Ratio
  • Turnover-to-Transition Speed

If one team suppresses controlled entries above 55-60% while the other depends on rush speed, Mark already knows the structure favors the defensive side.

The attacking team will lose quality over time, even if raw shot numbers look balanced.

The Coaching Staff Factor

  • Does the staff rely on speed transitions or controlled buildup?
  • Do they adapt when neutral traps shut them down?
  • Is there a tactical “Plan B”?

When a coaching staff is structurally rigid, neutral zone dominance becomes even more decisive in shaping Mark’s verdict.

4. Forecheck Efficiency – Pressure Without Shooting

Forechecking at elite level is not chaos. It is structured exit destruction.

  • forced dump-outs
  • failed breakouts
  • compressed recovery windows
  • accelerated defensive fatigue

Coaching Staff Influence in Forechecking

  • preferred forecheck structure
  • aggression timing
  • risk tolerance
  • in-game system switching

Metrics alone are not enough. Mark evaluates how the coaching staff deploys pressure and how stable this pressure is across all three periods before arriving at his verdict.

5. Slot Dominance – Why Shot Totals Deceive

Over 70% of elite-level goals originate from the slot or direct rebound aftermaths. Perimeter shots are often low-probability events; slot control is where real danger lives.

  • Slot Entry Frequency
  • Net-Front Battle Win Rate
  • Slot Denial Efficiency

One lost rebound battle can collapse an entire match structure.

Coach Mark studies not only numbers but also:

  • defensive coverage schemes
  • net-front defender roles
  • coaching reactions between periods

His final verdict always reflects which side is more likely to own the slot over sixty minutes, not just who shoots more.

6. Shift Load & Fatigue Control – The Invisible Match Killer

Fatigue is one of the most underestimated factors in hockey. It is rarely visible to casual viewers but constantly monitored inside a professional bench.

  • Average Shift Length
  • High-Intensity Burst Count
  • Recovery Windows
  • Late-Shift Error Clusters

Fatigue does not announce itself. It reveals itself through structural breakdowns.

Coach Decisions Under Fatigue

  • bench shortening behavior
  • timeout timing
  • rotation protection

When Mark sees a pattern of poor fatigue management from a coaching staff, his match verdict will always reflect the higher probability of late-period collapses and momentum swings.

7. The Real Pre-Game Checklist at IHM

Before any match verdict is published for IHM Premium, Coach Mark and his staff run through a structured pre-game checklist:

  1. Neutral Zone Geometry - who owns space between the blue lines.
  2. Forecheck Stability - who can consistently disrupt exits.
  3. Slot Control Projection - who is more likely to control the net-front area.
  4. Fatigue Curves - how each team’s structure behaves under load.
  5. Goaltender Visibility & Traffic - projected screen quality and rebound chaos.
  6. Bench Recovery Cycles - shift length, depth usage, and rest patterns.
  7. Coaching Staff Adaptation History - how each bench reacts when the original game plan fails.

Only after this structural analysis do they move to rosters, injuries, special teams, and schedule context. The verdict is the final product of this entire process, not a guess based on recent scores.

8. Why This System Outperforms Public Result-Driven Logic

Public thinking follows outcomes. Professional thinking follows structure.

Casual logic:

  • “This team is on a winning streak, they must be stronger.”
  • “They scored a lot recently, so they will keep scoring.”

Coach Mark’s logic:

  • “Who controls space and tempo?”
  • “Whose structure survives fatigue and pressure?”
  • “Which coaching staff reads the game faster and adjusts better?”

Processes always happen before results. That is why his verdicts are built on structural reality, not emotional narratives.

9. Why IHM Academy Exists

IHM Academy exists to teach how professional coaching staffs truly see the game – beyond highlights and surface statistics. It is designed for readers who want to think like a bench, not like a scoreboard.

Every Performance Metrics lesson is built to:

  • explain deep tactical concepts in clear language
  • connect numbers with video and coaching decisions
  • show why structure matters more than isolated plays
  • prepare you to understand the logic behind Mark’s verdicts

10. From Theory to Premium - How Knowledge Becomes Structure

  1. First you learn how hockey truly works at the structural level.
  2. Then you begin to understand why specific results appear on the scoreboard.
  3. Next you observe how Coach Mark and his staff apply the same principles in real pre-game work.
  4. Finally you develop analytical discipline and can evaluate match verdicts on a professional basis.

IHM Premium is not about guessing every game. It is about choosing your spots, identifying real structural edges, and respecting the game at the level of a coaching staff.

11. Final Truth

Hockey is not chaos. It is order disguised as chaos.

  • Structure before speed
  • Fatigue before mistakes
  • Slot before shots
  • Coaching decisions before visible outcomes

Where real analysis begins, long-term advantage follows. That is where Coach Mark’s verdicts are born.


IHM Academy · Performance Metrics Masterclass - Lesson 17

IHM Academy · Performance Metrics Masterclass – Lesson 17

Lesson 17 – Shift Load & Fatigue Control

The Hidden Physics of Winning Hockey

Most fans watch the puck. Coaches watch oxygen debt. Fatigue management is the invisible layer of elite hockey control.

1. Average Shift Length (ASL)

  • Forwards: 38-45 seconds
  • Defense: 45-55 seconds

2. High-Intensity Burst Count (HIBC)

After the 4th full-speed burst, muscle efficiency drops by 22-28%.

3. Recovery Window Index (RWI)

  • Below 90 sec - danger zone
  • 90-130 sec - operational
  • 130+ sec - optimal recovery

4. Fatigue Turnover Correlation (FTC)

Direct link between prolonged shift load and defensive giveaways.

5. Late-Shift Goal Probability (LSGP)

Goal against probability increases 2.6× in final 15 seconds of long shifts.

Lesson Summary

  • Fatigue destroys structure before skill
  • Shift control equals tactical control
  • Late goals are management failures

Q&A – Shift Load & Fatigue Control

Q1: Why do most goals occur late in shifts?

Because oxygen debt peaks, reaction time slows, and structural positioning collapses.

Q2: Can short shifts really outperform longer energy-saving shifts?

Yes. Short explosive shifts sustain speed, pressure intensity, and tactical discipline.

Q3: Which players suffer most from poor shift management?

Defensemen, because they face continuous directional transitions and lateral load accumulation.

Q4: How does fatigue directly affect puck control?

Hand-eye precision drops, first-touch quality degrades, and passing lanes close slower.

Q5: What is the most dangerous moment in shift fatigue?

The final 10-15 seconds, when players overcommit defensively and lose recovery positioning.


IHM Academy · Performance Metrics Masterclass - Lesson 16

IHM Academy · Performance Metrics Masterclass – Lesson 16

Lesson 16 – Slot Dominance Index

Why Games Are Won in Five Square Meters

The slot is not a location. It is a battlefield. Over 70% of elite-level goals originate from the slot area. Control of this zone decides offensive lethality and defensive survival.

1. Slot Entry Frequency (SEF)

  • Elite: 9-13 slot entries per period
  • Average: 6-8
  • Weak: below 6

2. Slot Shot Conversion (SSC)

Measures scoring efficiency from the slot.

  • Elite: 18-24%
  • Weak: below 12%

3. Slot Denial Efficiency (SDE)

Elite defenses block over 55% of slot attempts before they reach the goalie.

4. Net-Front Battle Win Rate

This metric defines which team owns rebounds, screens, and psychological goalie pressure.

Coaching Logic

Slot dominance controls:

  • Rebound frequency
  • Goaltender visibility
  • Defensive fatigue acceleration

Lesson Summary

  • Shots do not equal danger
  • Slot control equals scoreboard control
  • Rebounds win championships

Q&A – Slot Dominance Index

Q1: Why is slot control more important than total shots?

Because most perimeter shots have low scoring probability. Slot shots generate rebounds and chaotic defensive reactions.

Q2: What is the most common defensive mistake in slot coverage?

Puck watching. Defenders track the puck and lose body position against screened attackers.

Q3: Which players benefit most from slot dominance?

Power forwards, net-front specialists, rebound finishers, and high-slot shooters.

Q4: How is slot dominance trained in practice?

Through continuous low-zone cycling, rebound battle drills, and layered shooting patterns.

Q5: Does slot dominance affect goalie psychology?

Yes. Constant screens and deflections drastically reduce goaltender visual confidence and reaction predictability.


IHM Academy · Performance Metrics Masterclass - Lesson 15

IHM Academy · Performance Metrics Masterclass – Lesson 15

Forecheck Efficiency Matrix

How Elite Pressure Systems Destroy Opponent Structure

Forechecking is not speed. It is not aggression. It is synchronized spatial collapse under segmented time pressure. This lesson dissects how professional staffs measure forecheck success using structural disruption, not hits or shots.

1. First Pressure Contact Time (FPCT)

Measures time until first defensive pressure after opponent puck retrieval.

  • 0.8-1.4 sec - elite pressure
  • 1.5-2.1 sec - operational
  • 2.2+ sec - passive forecheck

2. Defensive Retrieval Denial (DRD)

Percent of failed opponent pickups under pressure. This reflects fatigue creation and panic acceleration.

3. Board Lock Time (BLT)

Measures how long the puck is held immobile along the boards under pressure. Extended BLT creates line fatigue and structural breakdowns.

4. F1-F2 Gap Control

Optimal distance between first and second checker is 2.5-4 meters. Larger gaps allow breakout passes. Smaller gaps expose counter-lanes.

5. Exit Failure Rate (EFR)

  • 35%+ - elite pressure
  • 25-34% - competitive
  • Below 25% – passive zone defense

Forecheck Systems

SystemStrengthRisk
1-2-2 AggressiveConstant pressureRush vulnerability
2-1-2Corner lock dominanceMiddle exposure
1-4Defensive denialInitiative loss

Teaching Application

Elite forechecking is synchronized muscle memory. It is spatial chess played at 35 km/h.

Lesson Summary

  • Forecheck destroys exits, not opponents
  • Pressure effectiveness is measured in disruption
  • The board is the real pressure zone

Q&A – Forecheck Efficiency Matrix

Q1: What defines an elite forecheck statistically?

Elite forechecking is defined by FPCT under 1.4 seconds and Exit Failure Rate above 35%.

Q2: Why do aggressive forechecks sometimes fail?

Because spacing between F1 and F2 becomes too tight, allowing one pass to bypass two attackers at once.

Q3: Is physical hitting required for an effective forecheck?

No. Angle control and stick positioning create more turnovers than body contact.

Q4: Which forecheck system is safest for protecting a lead?

The passive 1-4 system, which collapses central lanes and allows only low-danger perimeter entries.

Q5: Why is the board the main pressure zone?

Because movement options are limited, vision is restricted, and exits become predictable under pressure.


Performance Metrics Masterclass - Lesson 11 High-Event vs Low-Event Hockey: Identifying Team Identity Through Metrics

IHM Academy · Performance Metrics Masterclass - Lesson 11

Performance Metrics Masterclass – Lesson 11
High-Event vs Low-Event Hockey: Identifying Team Identity Through Metrics

By Coach Mark Lehtonen · IHM Academy

Some teams play chaotic, fast-paced, high-event hockey – trading rushes and relying on skill. Others play low-event, suffocating systems designed to shrink the game and limit volatility. Both styles can win. Metrics reveal which identity a team truly plays, regardless of what the coach claims.

🎯 What “Event Profile” Tells Us

  • How often a team generates vs. allows scoring chances
  • Whether the game becomes chaotic or controlled
  • Which teams thrive in chaos vs structure
  • What game states unlock their strengths

🧠 Key Concepts

1. High-Event Teams

These teams trade rushes, push pace and rely on skill.

  • High xGF and high xGA
  • Fast neutral-zone pace
  • Defensemen join the rush frequently
  • Games often finish 4-3, 5-4

2. Low-Event Teams

These teams compress everything and remove danger.

  • Low xGF and low xGA
  • Long defensive sequences
  • Simple exits, no risky pinches
  • Scorelines like 2-1, 3-2

3. Hybrid Identities

Most elite teams shift between profiles based on opponent and score effects.

💬 Coach Mark Lehtonen says

A high-event team without elite talent dies by chaos. A low-event team without discipline dies by boredom.

❌ Common Mistakes

  • Misreading low-event hockey as “bad offense”
  • Forcing a roster into the wrong identity
  • Ignoring opponent style when game-planning

Q&A – Event Profiles

Q1: Is high-event hockey better?

A: Only if your roster has high-end finishing and fast decision-makers.

Q2: Why do some strong teams play low-event?

A: Because they rely on structure, depth and goaltending, not star-driven chaos.

Q3: Can teams change identity mid-season?

A: Yes – coaching adjustments can shift pace drastically.

Q4: How do analytics determine identity?

A: By measuring overall shot volume, chance creation rate, pace and transition patterns.

🧱 Summary

Understanding event profile reveals how a team actually plays – and whether that identity matches their roster strength.


Performance Metrics Masterclass - Lesson 10 Microstats: Retrievals, Pressure Escapes & Puck-Touch Efficiency

IHM Academy · Performance Metrics Masterclass - Lesson 10

Performance Metrics Masterclass – Lesson 10
Microstats: Retrievals, Pressure Escapes & Puck-Touch Efficiency

By Coach Mark Lehtonen · IHM Academy

Microstats reveal the parts of the game traditional analytics never touch: retrieval timing, pressure escapes, puck-handling efficiency and decision sequencing. These actions don’t always show up in goals or assists, but they directly drive transition success, zone time and scoring chances.

Microstats measure how the play happens, not just what the outcome was.

🎯 What Microstats Capture

  • Speed and angle of puck retrievals
  • Efficiency of first-touch decisions
  • Success under forecheck pressure
  • Whether players choose the optimal lane
  • The tempo of puck movement during breakouts

🧠 Key Concepts

1. Retrieval Efficiency

Elite defenders reach pucks earlier, use better body positioning and escape pressure with fewer touches.

  • Retrieval Time: seconds it takes to reach the puck
  • First-Touch Quality: clean, bobbled, or forced retreat
  • Escape Success: pressure → clean breakout

2. Pressure Escape Rate

This metric evaluates how well skaters survive contact pressure and still make positive plays.

  • Shoulder checks before retrieval
  • Directional changes under pressure
  • Passing accuracy while contested

3. Puck-Touch Efficiency

Every touch either accelerates or slows the attack. Efficient players waste nothing.

  • Minimal unnecessary stickhandling
  • Immediate north-south decisions
  • High percentage of progressive touches

💬 Coach Mark Lehtonen says

Microstats don’t lie. You can’t hide slow retrievals, panic touches or wasted movements.

❌ Common Mistakes

  • Overhandling the puck → slows transition
  • No shoulder checks → blind turnovers
  • Retrieving with bad body angle → trapped instantly

Q&A – Microstats

Q1: Why do microstats matter if they don’t show up on the scoresheet?

A: Because micro-actions build the plays that lead to chances. Strong microstats predict strong systems play.

Q2: How can a coach use these metrics?

A: To identify who handles pressure well, who drives transition and who needs to simplify their puck decisions.

Q3: Are microstats more important for defensemen?

A: They’re vital for everyone, but defenders rely on them more because retrievals start every breakout.

Q4: Do elite players always have elite microstats?

A: Almost always – elite decision speed and puck efficiency are trademarks of top players.

🧱 Summary

Microstats expose the hidden mechanics behind elite play. Retrieval efficiency, pressure escapes and touch quality define a player’s true impact beyond goals and assists.


IHM Academy · Defensive Zone Coverage-Lesson 4

IHM Academy · Defensive Zone Coverage-Lesson 4

By Coach Mark Lehtonen · IHM Academy · Defensive Zone Coverage

IHM Academy – Defensive Zone Coverage · Lesson 4: Net-Front Defense & Slot Protection

The defensive zone does not break first on the boards - it breaks in the slot.

Teams that lose the middle of the ice give up screens, tips, and rebounds no system can survive. Net-front defense and slot protection are the backbone of every coverage. If the house stays strong, the rest of the structure can bend without breaking.

In this lesson we build clear rules for how defenders and forwards protect the blue paint, manage sticks, and control body position when the puck is high, low, or on the move.

IHM Academy - Defensive Zone Coverage · Lesson 4: Net-Front Defense & Slot Protection

🎯 Core Objectives

  • Keep the middle of the ice sealed in all coverages (box+1, overload, switch systems).
  • Establish simple, repeatable rules for who owns the net-front at every moment.
  • Teach defenders how to battle without taking unnecessary penalties.
  • Control sticks first, then bodies, then rebounds.
  • Turn net-front wins into clean exits instead of second and third chances.

🧠 Net-Front Role Definitions

1. D1 – Primary Net-Front Defender

  • Owns the space from the top of the crease to the low slot.
  • Plays inside position: body between attacker and goalie at all times.
  • Eyes on chest, stick under the attacker’s hands, not chasing the puck.
  • Finishes every shot sequence with a box-out and a quick shoulder check.

2. D2 – Support & Box Help

  • Stays one step above D1, ready to help on rebounds or second net-front attackers.
  • Protects the high slot when the puck is low, closes to the crease when it rises.
  • Responsible for “second touch” - clearing loose pucks after the first save.

3. Center – Slot Security

  • Is the first forward responsible for the middle lane.
  • Tracks late slot entries from opposing centers and high forwards.
  • Communicates switches when wingers are pulled down or inside.

4. Wingers – Inside-Then-Out

  • When the puck is high, start inside the dots before closing to the point.
  • If beaten inside, collapse to help on the slot rather than chasing wide.
  • On shot release, box out their side-lane attacker and look for loose pucks.

🔧 Technique – How to Defend the Net Front

Body Position

  • Feet outside the opponent’s skates, hips between attacker and goalie.
  • Stick blade on the ice in front of the attacker’s blade, not behind.
  • Shoulders low, legs loaded - ready to handle bumps without losing balance.

Stick & Hands

  • “Stick first” - lift, pin, or tie up before delivering contact.
  • Hands stay inside the frame; avoid wrapping arms around the opponent.
  • After shot release, attack the attacker’s stick for tips and rebounds.

Box-Out Timing

  • Engage early when the puck moves high - don’t wait on the crease.
  • Drive the attacker out of the blue paint, then hold ice, not the jersey.
  • Release contact quickly when your team gains possession to avoid penalties.

📊 Read Structure by Puck Location

Puck High at the Blue Line

  • D1 locks net-front attacker; sticks and screens managed first.
  • D2 protects mid-slot and is ready to step into shooting lane.
  • Center shades toward the high slot to deny bumper and seam plays.
  • Wingers stay inside dots, then close to their points on the pass.

Puck Low Below the Goal Line

  • D1 fronts the net-front attacker, not the puck carrier.
  • D2 supports behind or beside the net battle depending on system rules.
  • Center collapses to the middle to protect the “royal road” pass.
  • Weak-side winger slides into the hashmarks to help on backdoor threats.

Puck in the Slot or on Net-Front Scramble

  • All defenders collapse inside hashmarks with sticks sweeping inside-out.
  • Priority order: 1) sticks, 2) bodies, 3) loose puck, 4) exit.
  • First touch clears the danger area, even if it means an icing when under heavy pressure.

💬 Coach Mark Lehtonen says

If we own the blue paint, we can survive bad shifts. If we lose the blue paint, even good structure breaks.

Net-front defense is not about cross-checks. It’s about inside feet, strong sticks, and winning the first rebound.

❌ Common Mistakes & Consequences

MistakeWhy it breaks coverage
D1 plays puck, not bodyScreen and tip are uncontrolled; goalie never sees the shot
Center cheats low boardsHigh slot opens; one-timers from the middle become automatic chances
Late box-out on shot releaseAttacker already set inside; defender is chasing from behind and takes penalties
Wingers defend outside the dotsInterior lanes open, weak-side sticks are free on backdoor plays
Poor rebound decisionsPuck cleared into traffic instead of corners, leading to extended pressure

🧪 Micro-Drills & Coaching Cues

  • 1v1 Net-Front Battle Ladder: D1 vs. net-front forward, shots from the point, focus on stick ties and early box-out.
  • 2v2 Low & Net-Front: Puck starts below the goal line; D1 and D2 communicate who owns net-front, who supports the puck.
  • Rebound Clear Drill: Coach shoots from the blue line; defenders must box out, win first touch, and clear to safe lanes within two seconds.
  • Center Slot Read Drill: Centers start high, track late slot entries, and arrive inside the offensive player at shot release.

Q&A – Defensive Zone Coverage

Q1: What matters more – moving the attacker or clearing sightlines for the goalie?

A: They are connected. If you win inside position early, you remove both the screen and the inside stick. When you are late, don’t chase the hit - first fight to open the goalie’s eyes, then move the attacker out of the crease.

Q2: Should defenders cross-check in front of the net?

A: Controlled bumps are fine; constant cross-checks are not. We teach “lift, bump, hold inside ice” - strong posture and stick work instead of reckless force that leads to penalties.

Q3: How do smaller defensemen survive net-front battles?

A: With feet and leverage. Get under the attacker’s hands, win inside lane early, and use quick bumps and stick lifts. Smaller D who arrive first with good angles often win more net-front battles than big D who arrive late and upright.

Q4: Where should the first rebound go?

A: Out of the house – into the corners or behind the net. Middle ice is never an option. The first touch doesn’t need to be pretty; it just needs to remove the immediate scoring threat.

🧱 Summary

Net-front defense and slot protection are the insurance policy of every defensive-zone system. When your team owns the blue paint with clear roles, strong sticks, and disciplined body position, you turn dangerous shots into one-and-done chances instead of extended chaos.

Systems may change from year to year – box+1, overload, rotations - but the rule stays the same: the middle never breaks.

IHM Academy · Performance Metrics Masterclass - Lesson 7

IHM Academy · Performance Metrics Masterclass – Lesson 7

Performance Metrics Masterclass – Lesson 7: Skater Impact Metrics (Isolated Impact, RAPM & Game Score)

Points don’t tell the full story. In modern hockey, some of the most valuable skaters drive play, tilt the ice and suppress chances without ever touching the scoresheet. That is why elite programs use impact metrics like isolated impact models, RAPM and game score to understand the true value of a player.

These metrics strip away noise from teammates, usage and luck. They aim to answer one key question:

“What happens to shot quality and game flow when this player is on the ice?”

🎯 Core Objectives of Skater Impact Metrics

  • Measure how a player influences xGF/xGA when on the ice.
  • Separate individual impact from linemates and deployment.
  • Identify undervalued drivers who help winning but don’t rack up points.
  • Flag players whose raw boxscore stats are driven by context, not true impact.

🧠 Key Concepts

1. On-Ice xGF/xGA Differential

  • xGF/60 on-ice: expected goals for when the player is on the ice.
  • xGA/60 on-ice: expected goals against in the same minutes.
  • xG differential: xGF/60 − xGA/60 – a simple impact snapshot.

Positive differential means the team is more likely to out-chance opponents with that player on the ice. Negative differential is a red flag, even if the player scores sometimes.

2. RAPM (Regularized Adjusted Plus-Minus)

RAPM models try to adjust for:

  • Teammates and opponents.
  • Zone starts and deployment.
  • Score effects and usage patterns.

The result is a set of numbers that estimate how much the player alone drives:

  • xGF (offensive shot quality).
  • xGA (defensive shot quality against).
  • Shot rates and expected goal rates relative to league average.

3. Isolated Impact Models

Isolated impact or “isolated threat” models visualize how a skater changes scoring chance patterns:

  • Red areas: locations where the team generates more threat with the player on the ice.
  • Blue areas: locations where the team allows less threat with the player on the ice.

This helps identify true offensive drivers, net-front specialists, blue-line shooters and defensive stoppers.

4. Game Score & Single-Game Impact

Game score compresses a player’s single-game contribution into one number using:

  • Goals and assists.
  • Shot attempts and chances.
  • Penalty differential.
  • On-ice shot metrics at 5-on-5.

Over time, average game score shows how consistently a player impacts results night after night.

💬 Coach Mark Lehtonen says

Points show who finished the play. Impact metrics show who created the play.

Smart teams pay for drivers, not passengers.

❌ Common Mistakes

MistakeWhy it’s a problem
Judging players only by pointsMisses defensive value, transition impact and play-driving
Ignoring context and deploymentOverrates players with easy minutes, underrates tough-matchup players
Looking at raw plus-minusHeavily influenced by luck, goaltending and team strength
Using one metric in isolationNo single model is perfect; decisions should blend multiple views

🧪 Micro-Assignments

  • Pick one player and track his on-ice xGF/xGA over 10 games; compare to his points.
  • Identify a “quiet driver” whose RAPM or isolated impact is strong despite low scoring.
  • Compare game score for a star who scores but leaks chances vs. a two-way driver.

Q&A – Coach Mark Lehtonen

Q1: Why aren’t points enough to evaluate a skater?

A: Points only capture finishing and last touches. Impact metrics show how a player affects shot quality, possession and chance flow over all his minutes, not just on scoring plays.

Q2: Are impact models perfect?

A: No metric is perfect. RAPM and isolated impact models are powerful tools, but they must be combined with video, role context and coaching judgment.

Q3: Can a player with low points still be elite by impact metrics?

A: Yes. Some players drive entries, retrievals and defensive stops that set the stage for others. Impact models often reveal these hidden engines.

Q4: How should fans start using these numbers?

A: Start with on-ice xGF/xGA differential, then add RAPM charts and isolated impact maps. Look for consistency across seasons before making strong conclusions.

🧱 Summary

Skater impact metrics turn raw events into a clearer picture of who truly drives winning. They adjust for context, separate passengers from drivers and help us find value that the boxscore hides. When you combine them with smart video, you start thinking like a modern front office.


IHM Academy · Performance Metrics Masterclass - Lesson 5

IHM Academy · Performance Metrics Masterclass – Lesson 6

Performance Metrics Masterclass – Lesson 6: Possession Chains & Puck Retrieval Metrics

Modern hockey is not just about who shoots more, but about who owns the puck longer in dangerous sequences. Possession is built in chains: recoveries, passes, attacks, rebounds, and pressure resets. Every time your team wins a puck and turns it into a sustained sequence, you are building a possession chain.

Puck retrieval metrics show who actually wins the right to attack again – after dump-ins, rebounds, blocked shots, broken plays, and loose pucks on the wall. Elite programs track these numbers shift by shift, player by player.

You don’t just want shots. You want repeated, connected possessions that suffocate the opponent.

🎯 Primary Objectives

  • Measure how often your team turns loose pucks into new possessions.
  • Identify players who extend offensive pressure through retrievals.
  • Understand which lines create multi-chance sequences, not one-and-done attacks.
  • Link retrieval metrics to xG chains, zone time, and fatigue on the opponent.

🧠 Key Concepts

1. Possession Chains

A possession chain is the full sequence from winning the puck to losing it again:

  • Recovery → pass → entry or cycle → shot → rebound / retrieval → second attack.

Instead of looking at a single shot, we look at the entire sequence and ask:

  • How many events (passes, shots, retrievals) did we create in this chain?
  • How much xG was generated across the whole sequence?
  • How long did we keep the puck before turning it over?

Teams with strong possession chains don’t just “take shots” – they live in the offensive zone.

2. Puck Retrieval Metrics

Retrievals are the glue that connect one action to the next. Key metrics:

  • Offensive Zone Retrieval % – percentage of dump-ins, rebounds and loose pucks your team recovers in the O-zone.
  • Defensive Zone Retrieval % – how often you win races to loose pucks in your own end and start a new exit.
  • Rebound Retrieval % – share of rebounds your forwards win after your first shot.
  • Wall Battle Win Rate – how often your players come out with the puck after contact on the boards.

These numbers show who keeps plays alive when the puck is up for grabs.

3. Chain Length & Quality

Not all chains are equal. We care about:

  • Average chain length (in events or seconds of puck possession).
  • xG per chain – how much expected offense each chain produces.
  • Multi-shot chain rate – percentage of chains that produce 2+ shots.

Longer, higher-quality chains wear down defenders, draw penalties, and create momentum swings.

🧩 Role Impact

Defensemen

  • Clean first touches after retrievals: off the glass is a last resort, not a habit.
  • Smart keep-ins at the blue line extend chains and pin the opponent.
  • Good gap and stick position in the neutral zone create easy retrievals for teammates.

Centers

  • Primary support on loose pucks in all three zones.
  • Turn retrievals into immediate middle-lane plays instead of safe dumps.
  • Drive the “second wave” after initial shots – arrive in time to win rebounds.

Wingers

  • First on the forecheck; first on the wall on dump-ins.
  • Win races and seal the inside lane during battles.
  • Turn 50/50 pucks into offensive starts, not defensive scrambles.

🔧 Core Metrics & What They Mean

  • O-Zone Retrieval % – ability to keep the attack alive after dump-ins and shots.
  • Rebound Retrieval % – pressure on the goalie and defense after the first shot.
  • Chain xG – how dangerous your average possession sequence is.
  • Multi-shot Chain Rate – indicator of sustained pressure, not one-and-done hockey.
  • Wall Battle Win Rate – physical and technical execution under pressure.

💬 Coach Mark Lehtonen says

“Great teams don’t play one-shot hockey.
They build waves of pressure from every loose puck.”

“If you can’t retrieve, you can’t attack twice.
The second chance is where playoff games are won.”

❓ Q&A – Possession & Retrieval

Q1: Why are puck retrieval metrics more informative than just shot counts?

A: Shot counts only show how many attempts you had, not how you got them. Retrieval metrics reveal whether your team can extend attacks, win second chances and live in the offensive zone. A team with fewer shots but elite retrieval and chain xG can be more dangerous than a volume team that plays one-and-done hockey.

Q2: Which players usually lead in retrieval metrics?

A: Often it’s not the top scorers but the “engine” players – strong-skating wingers, smart centers and mobile defensemen who read loose pucks early. They may not finish every play, but they give your scorers extra chances by extending chains.

Q3: How can a coach improve O-zone retrieval %?

A: Focus on routes and timing on the forecheck, not just effort. F1 drives the puck, F2 reads the wall, F3 protects the middle. Teach players to seal the inside, keep sticks in lanes and react as a unit when the puck is chipped or blocked. The earlier the read, the easier the win.

Q4: How do these metrics help with scouting and player evaluation?

A: Retrieval and possession-chain data identify players who drive winning hockey even without big point totals. A winger who consistently wins pucks back and extends sequences can be more valuable than a scorer who disappears when the puck is contested.

❌ Common Mistakes

MistakeConsequence
Watching the shot instead of reading the reboundOpponents win easy clears and kill momentum
Flying past the play on the forecheckNo inside position; 50/50 pucks become 30/70
Defensemen defaulting to rims under light pressureLost possession chains and uncontrolled exits
Forwards circling high instead of stopping on pucksLost battles on the wall; no second chances
No tracking of retrieval metricsCoaches misjudge effort vs. actual possession impact

🧪 Micro-Drills

  • Rebound Hunt Drill – shot from the point, two forwards vs. two defenders battle for every rebound; track retrieval %, not just goals.
  • Dump-In Retrieval Race – structured dump with F1/F2/F3 routes; scoring only counts if the puck is retrieved and a second shot is created.
  • Wall Battle into Cycle – 1v1 or 2v2 on the boards; winner must make a play off the wall to extend the chain, not just clear.

🧱 Summary

Possession chains and puck retrieval metrics explain why some teams feel relentless. They win loose pucks, extend sequences and attack in waves. When you track and train these details, you move from counting shots to controlling the game.

You don’t just want the first chance. You want the next one, and the one after that.